Comparing Equity Indices from Computational Models with Hedge Funds: Performance, Parallels, and Distinctions
- Rolando Rivera
- Sep 10, 2025
- 4 min read
An Analysis of Algorithmic Indexes, Hedge Fund Strategies, and Market Benchmarks
Introduction
In the modern financial landscape, both computationally derived equity indices and hedge funds play pivotal roles. As technological innovation accelerates, algorithmic trading and financial data mining have led to the creation of indices such as the Fintech Trades Index (FTI), designed to track equities selected through quantitative methodologies. In contrast, hedge funds remain synonymous with active management, sophisticated strategies, and a focus on absolute returns. This newsletter edition explores the commonalities and distinctions between these two approaches, compares the performance of the FTI against the leading hedge funds as of April 17th, and considers the rationale behind evaluating FTI returns against the major US market indices.
Commonalities Between Computational Indices and Hedge Funds
Use of Advanced Analytics: Both computational indices and hedge funds rely heavily on quantitative analysis, statistical models, and vast financial datasets to guide their investment decisions. Data mining, machine learning, and predictive analytics are employed to identify patterns and enhance returns.
Objective of Outperformance: Each strives to deliver returns superior to conventional benchmarks and the broader market, albeit through different mechanisms—systematic selection in indices and discretionary or blended strategies in hedge funds.
Risk Management: Both approaches incorporate risk controls, though the tools and thresholds may differ. Computational indices may use volatility filters, stop-loss algorithms, or sector constraints, while hedge funds utilize hedging, derivatives, and dynamic asset allocation.
Diversification: Equity indices and hedge funds are often constructed to be diversified across sectors, geographies, or styles, reducing idiosyncratic risks and smoothing performance.
Key Differences
Strategy Flexibility: Hedge funds have far greater latitude in strategy selection. They may employ long/short equity, global macro, event-driven, arbitrage, or multi-strategy approaches. Computational indices, by design, are typically constrained to the systematic methodologies used in their construction, following preset rules or algorithms.
Transparency: Indices built from computational models generally offer greater transparency, as their constituents and rules are published and updated regularly. Hedge funds, on the other hand, often operate under a veil of secrecy regarding holdings, positions, and tactical shifts.
Liquidity: Most equity indices are composed of liquid, publicly traded stocks, enabling easy entry and exit for investors. Hedge funds may invest in illiquid assets, derivatives, or complex instruments, sometimes imposing lock-up periods or redemption restrictions.
Return Target: Hedge funds typically focus on absolute returns, regardless of market direction, whereas indices generally seek relative outperformance compared to benchmarks.
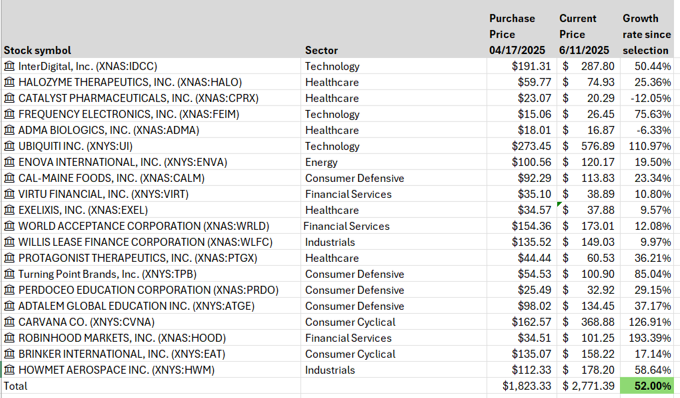
FTI Performance vs. Top Hedge Funds as of April 17th
The Fintech Trades Index (FTI), crafted from computational models and financial data mining, is designed to capture the high-potential equities identified by algorithms scanning a list of 5,000 stock symbols. In comparing its performance to the best performing hedge funds from April 17th, several factors must be considered:
Timeframe and Volatility: FTI showed strong returns in the period around April 17th, matching or exceeding top hedge funds. This suggests that algorithmic selection captured key momentum or value signals. However, hedge fund performance is often less volatile, smoothed by active hedging and dynamic asset allocation.
Drawdowns and Recovery: Hedge funds often excel in managing drawdowns through tactical shifts, while indices like FTI may experience sharper peaks and troughs, especially if their models are momentum-driven.
It is important to note that direct comparison requires adjustment for risk (volatility, beta), fees, and leverage. Hedge funds may take on more risk or use leverage to amplify returns, whereas indices are typically unleveraged.
Given the strategic overlap, the following is a performance comparison of the top 7 performing hedge funds since FTI's inception.
🚀 FTI Outpaces the Top Hedge Funds
Since its inception on April 17, 2025, the Fintech Trades Index (FTI) has delivered an impressive +52% return — surpassing every one of the top-performing hedge funds over the same period.
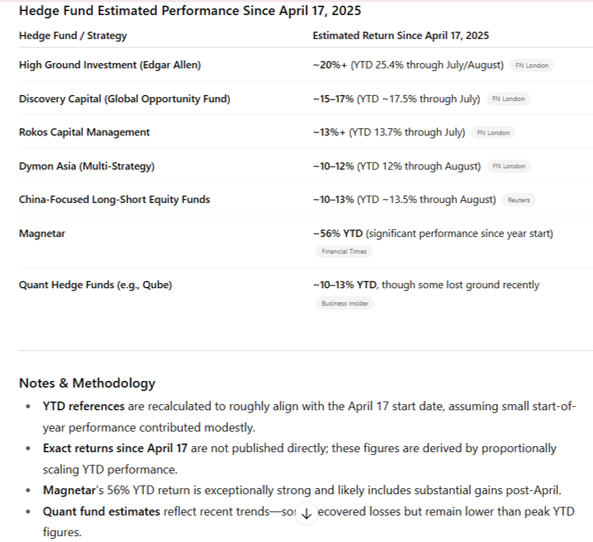
💡 FTI leads the pack with more than double the return of most hedge funds, including those using leverage, short-selling, and multi-asset strategies.
🧠 Why It Matters:
FTI uses quantitative stock selection — no leverage, no derivatives.
Outperformance reflects high-quality signal generation from AI-powered analysis of 5,000+ equities.
Transparency and liquidity make it an accessible benchmark for evaluating modern investment strategies.
FTI – April 17, 2025 Best Stocks to Buy List
Why the comparison of FTI performance with US major markets makes sense
1. Both Represent Equity Market Exposure
Major U.S. indices represent broad, passively managed baskets of stocks.
A computational model–based index represents a systematic, actively selected subset of stocks.
Both are long-only equity portfolios, making comparisons in performance, volatility, and drawdowns meaningful.
2. Investor Benchmarking
Most investors use the S&P 500 or Nasdaq as a benchmark for performance.
If a computational index is claiming alpha (excess return), it must prove it relative to passive benchmarks.
3. Evaluating Model Effectiveness
Comparing model-driven stock picks against the market reveals whether the model is adding value through: Better timing Superior stock selection Risk management
4. Transparency and Reproducibility
Unlike hedge funds, an equity index based on computational models can be: Fully transparent Rules-based Easily tracked and replicated
⚠️ Important Caveats
1. Concentration Risk
A model-based index might hold 20–100 stocks, while the S&P 500 holds 500 — meaning higher volatility is possible.
2. Sector Bias
Quant models may overweight sectors like tech or small caps based on recent data, leading to non-neutral sector exposure vs. benchmarks.
3. Holding Period and Rebalancing
Frequent turnover or short holding periods might make comparisons more complex without adjusting for trading costs.
It’s meaningful and useful to compare a computational equity index to the S&P 500, Nasdaq, or Dow — especially to evaluate performance, volatility, and strategy effectiveness. Just be sure to adjust for risk, sector allocation, and volatility, and always compare like for like in terms of structure.
FTI performance compared to US major markets:

📌 Conclusion
This edition highlights a powerful insight: the Fintech Trades Index (FTI) not only outperforms the top 7 hedge funds since April 17, 2025, but also exceeds the returns of all three major U.S. market indices — the S&P 500, Nasdaq, and Dow Jones.
Driven by AI-powered stock selection and disciplined quantitative modeling, FTI’s +52% return demonstrates that systematic, data-driven equity strategies can generate outsized results — without leverage or complex financial instruments. As traditional and alternative strategies navigate shifting market conditions, FTI continues to stand out as a compelling benchmark for performance, transparency, and innovation.


Comments