Data in Motion and Financial Forecasting
- Rolando Rivera
- Mar 28
- 1 min read
Updated: Apr 10
There are numerous types, categories, and purposes for collecting data. For instance, data comprises your personal details such as your social security number, address, and bank account information. In the financial services industry, data encompasses all information related to the financial activities of publicly traded companies.

Data also has physical attributes like temperature, volume, density, and motion.

Temperature is measured by access rates. Frequent access increases the heat. Data that is seldom used, like backups and archives, is considered cold.
Volume is quantified by the data amount in megabytes, gigabytes, terabytes, and so on.
Density refers to the relationship between volume and container, indicating how much data is stored in a given unit of storage.
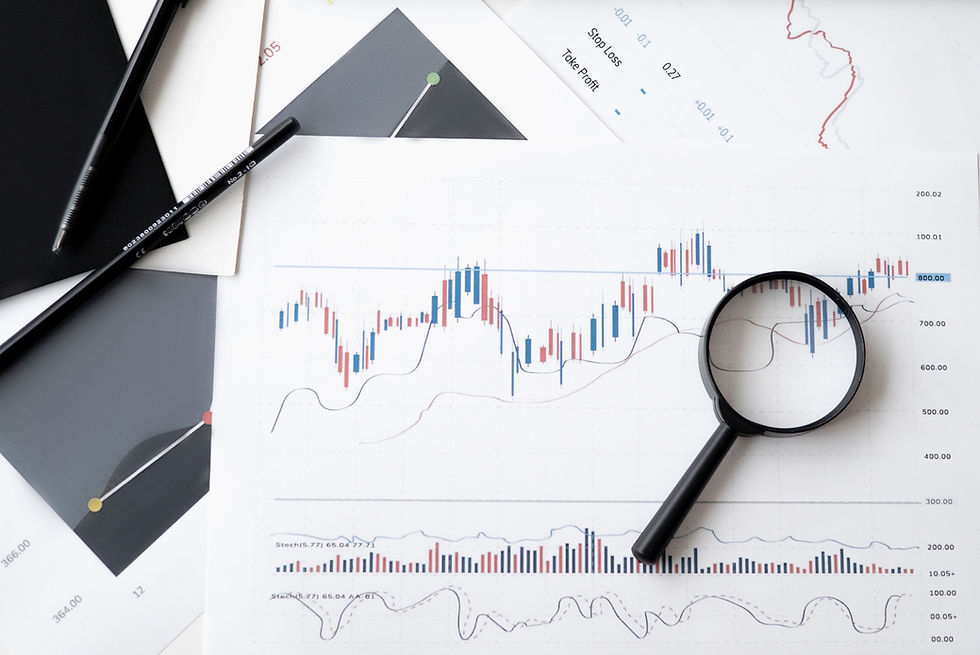
Motion is derived from the visualization of values over a period of time. For instance, imagine a geometric object in motion. The stock price of a single company over the course of one year is data in motion.

Price fluctuations define the shape of this geometric object. This object's form is derived from the five stock prices within a weekly interval. As the year advances, the object alters its shape and shifts forward, upward, and downward. The Geometric Brownian Motion formula and other statistical models can utilize this data attribute for forecasting price trends.
Login to see how this concept works at https://www.fintechtrades.com.


コメント